Intro to Streamlit
by Bill Jellesma2025-02-15 00:00:00

What if I told you that we can build a web interface for all of our data science graphs only using Python? How about if I tell you that we can build a machine learning web application? This can all be accomplished using a tool called Streamlit and without giving data science the headache of having to learn javascript or even HTML.
TL;DR
We'll be building a binary classifier that the user can run and display in the browser. The user will be able to choose from Support Vector Machine, Logistic Regression, or Random Forest models and be able to select a few hyperparameters. We'll use Scikit-Learn to run the machine learning algorithms as well an Pandas to be able to read in data from our CSV.
Install
Let's first create the basic hello world using Streamlit.
Our first task is that we need to download and install Streamlit.
pip install Streamlitimport streamlit as st
def main():
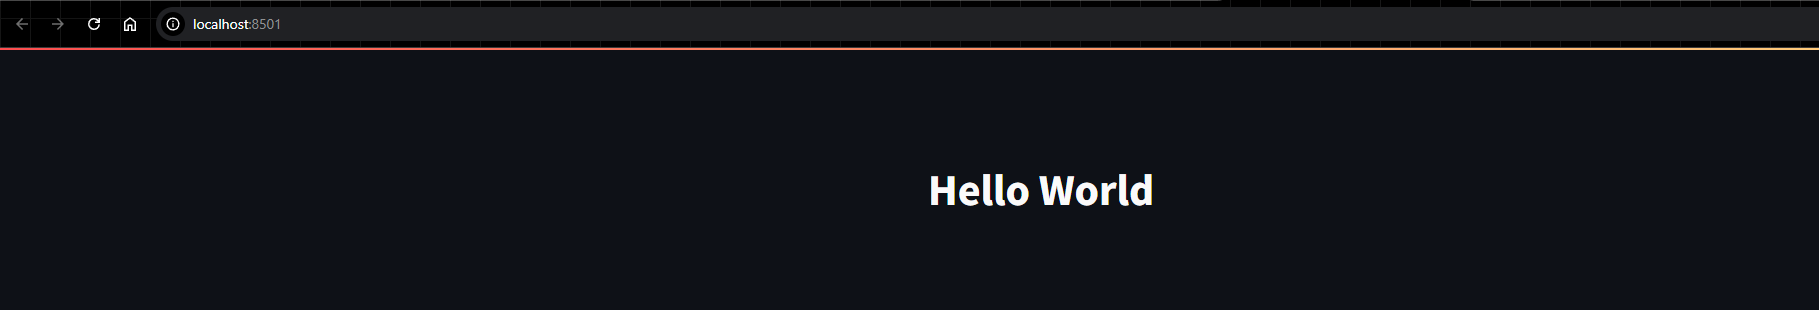
st.title("Hello World")
if __name__ == '__main__':
main()You can run this code with
streamlit run app.pyThe first time that you run Streamlit, you'll see the following prompt for an email. You can fill this in or leave this blank but personally I like to disable this prompt because if I deploy this app in a docker container later on, this prompt will show everytime I rebuild the container.
 Welcome to Streamlit!

      If you’d like to receive helpful onboarding emails, news, offers, promotions,
      and the occasional swag, please enter your email address below. Otherwise,
      leave this field blank.

      Email:
In order to disable this prompt, you can pass a flag for headless mode.
streamlit run app.py --server.headless trueYou'll now see output that looks like the following:
You can now view your Streamlit app in your browser.

  Local URL: http://localhost:8501
  Network URL: http://x.x.x.x:8501
  External URL: http://x.x.x.x:8501
You can click one of the above links and you should see the following in your browser.
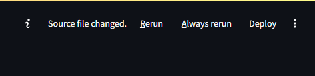
We can set Streamlit to have hot reloading so that whenever we make a change to the file, the browser automatically reloads. Let's change "Hello World" to "Hello Goodbye".
import streamlit as st

def main():
    st.title("Hello Goodbye")

if __name__ == '__main__':
    main()
When we save the file, we'll see the following on the browser window letting us know that one of the files has changed and we can set Streamlit to automatically reload by clicking "Always Rerun". Note that whenever you reload the app or refresh the webpage, you'll be prompted to rerun again.
Adding in Pandas
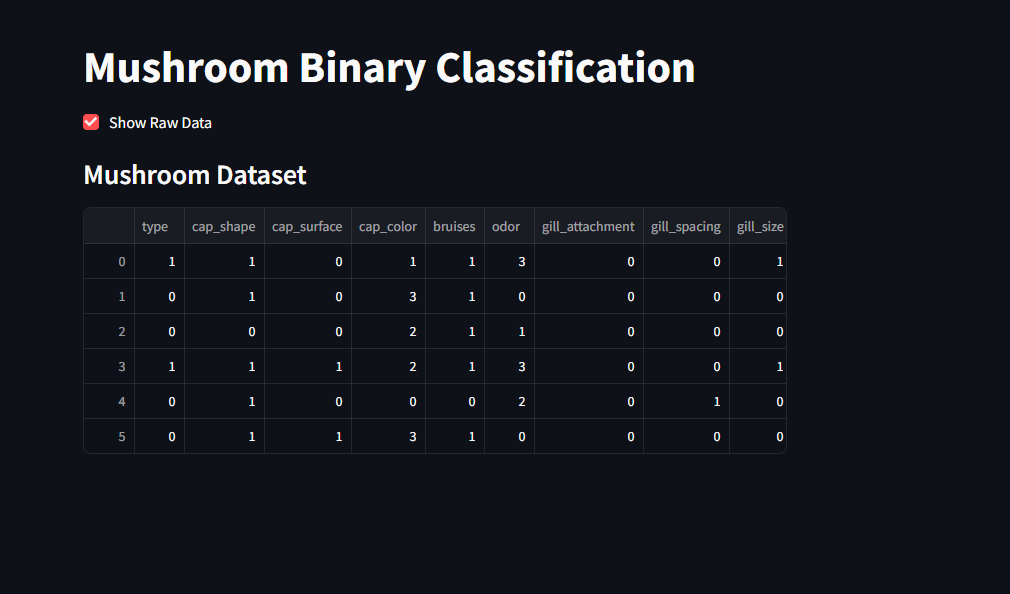
Now that we've got the basics of what Streamlit can do, let's dive deeper by making a dataframe and displaying some useful data! Let's pretend that we have the following CSV data that will tell us some information about mushrooms. Our intent is that by providing all this labeled data about mushrooms, we can build a machine learning classifier to tell us whether a mushroom is edible or not.
type,cap_shape,cap_surface,cap_color,bruises,odor,gill_attachment,gill_spacing,gill_size,gill_color,stalk_shape,stalk_root,stalk_surface_above_ring,stalk_surface_below_ring,stalk_color_above_ring,stalk_color_below_ring,veil_type,veil_color,ring_number,ring_type,spore_print_color,population,habitat
p,x,s,n,t,p,f,c,n,k,e,e,s,s,w,w,p,w,o,p,k,s,u
e,x,s,y,t,a,f,c,b,k,e,c,s,s,w,w,p,w,o,p,n,n,g
e,b,s,w,t,l,f,c,b,n,e,c,s,s,w,w,p,w,o,p,n,n,m
p,x,y,w,t,p,f,c,n,n,e,e,s,s,w,w,p,w,o,p,k,s,u
e,x,s,g,f,n,f,w,b,k,t,e,s,s,w,w,p,w,o,e,n,a,g
e,x,y,y,t,a,f,c,b,n,e,c,s,s,w,w,p,w,o,p,k,n,g
First let's install Pandas to read a CSV. I've named my CSV data.CSV and put this in the same directory.
pip install pandasimport streamlit as st
import pandas as pd
@st.cache_data(persist=True)
def load_data():
"""
load data from a CSV and display it
"""
data = pd.read_csv('data.CSV')
for col in data.columns:
st.markdown(f'**Col**: {col}')
def main():
st.title("Hello Goodbye")
load_data()
if __name__ == '__main__':
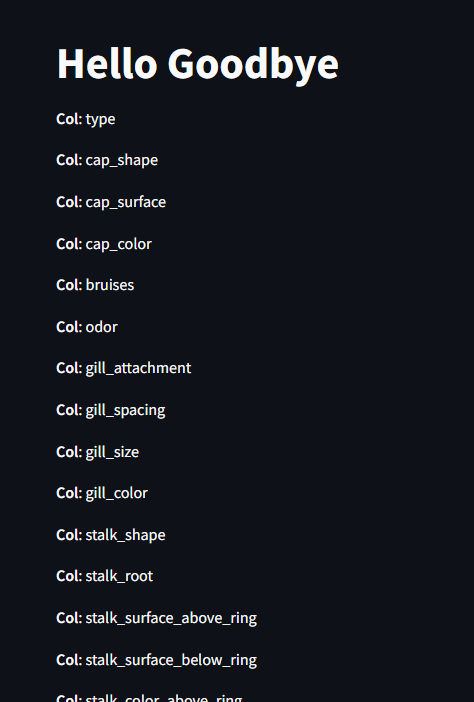
main()So we're defining a new function called load_data that'll simply load the columns of the CSV and output them. We're using another Streamlit function called markdown() so that we can use markdown formatting (bold in our case) and display that on screen. We're also using the decorator @st.cache_data which will cache the CSV so that we don't need to reload it. The persist param will only rerun the data if the function definition changes between runs.
Saving our file shows:
Adding in Scikit
Now we're cooking with gas! Let's add in scikit-learn, a popular machine learning library, to handle encoding for our labels.
pip install scikit-learnimport streamlit as st
import pandas as pd
from sklearn.svm import SVC
from sklearn.linear_model import LogisticRegression
from sklearn.ensemble import RandomForestClassifier
from sklearn.preprocessing import LabelEncoder
from sklearn.model_selection import train_test_split
from sklearn.metrics import ConfusionMatrixDisplay , RocCurveDisplay, PrecisionRecallDisplay
from sklearn.metrics import precision_score, recall_score
@st.cache_data(persist=True)
def load_data():
"""
load data from a CSV and label encode it
"""
data = pd.read_csv('data.CSV')
for col in data.columns:
label = LabelEncoder()
for col in data.columns:
data[col] = label.fit_transform(data[col])
return data
def main():
st.title("Mushroom Binary Classification")
df = load_data()
# Create checkbox to show df if clicked
is_raw_checked = st.checkbox("Show Raw Data", False)
if is_raw_checked:
st.subheader("Mushroom Dataset")
st.write(df)
if __name__ == '__main__':
main()What we've done is enhanced our load_data() function to now encode every label as an integer to prepare it for machine learning training. We've also created a togglable checkbox on the main function that we can use to view the raw data that we have after being label encoded.
Split the dataset
Next, let's split the dataset into a training and a test set for the model to train on.
import streamlit as st
import pandas as pd
from sklearn.svm import SVC
from sklearn.linear_model import LogisticRegression
from sklearn.ensemble import RandomForestClassifier
from sklearn.preprocessing import LabelEncoder
from sklearn.model_selection import train_test_split
from sklearn.metrics import ConfusionMatrixDisplay , RocCurveDisplay, PrecisionRecallDisplay
from sklearn.metrics import precision_score, recall_score

@st.cache_data(persist=True)
def load_data() -> pd.DataFrame:
    """
    load data from a CSV and label encode it
    """
    data = pd.read_csv('data.CSV')
    for col in data.columns:
        label = LabelEncoder()
        for col in data.columns:
            data[col] = label.fit_transform(data[col])
    return data

@st.cache_data(persist=True)
def split_train_test(df: pd.DataFrame, test_size:float=0.3) -> tuple[np.ndarray, np.ndarray, np.ndarray, np.ndarray]:
    """
    split dataframe into training and test sets
    """
    # y value will be the output while all the features are in the input (x)
    y = df.type
    x = df.drop(columns=['type'])
    # use sklearn helper to split data, set random as 0 for reproducability
    return train_test_split(x,y,test_size=test_size, random_state=0)

def main():
    st.title("Mushroom Binary Classification")
    df = load_data()

    # Create checkbox to show df if clicked
    is_raw_checked = st.checkbox("Show Raw Data", False)
    if is_raw_checked:
        st.subheader("Mushroom Dataset")
        st.write(df)

    # create splits
    x_train, x_test, y_train, y_test =  split_train_test(df=df)
    is_show_splits = st.checkbox("Show Data Splits", False)
    if is_show_splits:
        st.subheader("Training Set")
        st.write(x_train)
        st.subheader("Test Set")
        st.write(x_test)

if __name__ == '__main__':
    main()
What we've done is create a split_train_test() function to split our data. This function will modify the CSV by using the type columns as the y value and everything else as the input set (x) to our model. Finally, I've made another toggleable checkbox to see our training and testing sets
Optionally, I've added some type annotations for documentation purposes. This just makes the life of a developer easier because then their development environment will tell them what the function expects.
Choose your classifier
Let's make use of a Streamlit selectbox to give the user a dropdown to choose the model classifier that they want to use.
import streamlit as st
import pandas as pd
from sklearn.svm import SVC
from sklearn.linear_model import LogisticRegression
from sklearn.ensemble import RandomForestClassifier
from sklearn.preprocessing import LabelEncoder
from sklearn.model_selection import train_test_split
from sklearn.metrics import ConfusionMatrixDisplay , RocCurveDisplay, PrecisionRecallDisplay
from sklearn.metrics import precision_score, recall_score

@st.cache_data(persist=True)
def load_data() -> pd.DataFrame:
    """
    load data from a CSV and label encode it
    """
    data = pd.read_csv('data.CSV')
    for col in data.columns:
        label = LabelEncoder()
        for col in data.columns:
            data[col] = label.fit_transform(data[col])
    return data

@st.cache_data(persist=True)
def split_train_test(df: pd.DataFrame, test_size:float=0.3) -> tuple[pd.DataFrame, pd.DataFrame, pd.DataFrame, pd.DataFrame]:
    """
    split dataframe into training and test sets
    """
    # y value will be the output while all the features are in the input (x)
    y = df.type
    x = df.drop(columns=['type'])
    # use sklearn helper to split data, set random as 0 for reproducability
    return train_test_split(x,y,test_size=test_size, random_state=0)

def main():
    st.title("Mushroom Binary Classification")
    df = load_data()

    # create splits
    x_train, x_test, y_train, y_test =  split_train_test(df=df)

    # allow the user to choose a model/classifier
    classifier = st.selectbox("Choose Classifier Model", options=("Support Vector Machine (SVM)", "Logistic Regression", "Random Forest"))
    metrics = st.multiselect("Metrics", options=('Confusion Matrix', 'ROC Curve', 'Precision Recall Curve'))
    if classifier == "Support Vector Machine (SVM)":
        pass
    elif classifier == 'Logistic Regression':
        pass
    elif classifier == 'Random Forest':
        pass

    # Create checkbox to show df if clicked
    is_raw_checked = st.checkbox("Show Raw Data", False)
    if is_raw_checked:
        st.subheader("Mushroom Dataset")
        st.write(df)

    # show splits dataframes
    is_show_splits = st.checkbox("Show Data Splits", False)
    if is_show_splits:
        st.subheader("Training Set")
        st.write(x_train)
        st.subheader("Test Set")
        st.write(x_test)


if __name__ == '__main__':
    main()
So the only difference is that we're adding the classifier choice to the main function. This will allow the user to choose the model that they want to use and have it run. Pretty cool, huh? Well not quite, we're just setting up the dropdown (selectbox) for the user and we're not actually doing anything yet. This is why you see the keyword pass which means do nothing.
Choose your hyperparameters
Just like how we're giving the user a choice of the classifier that they'll use, we want to also give the user a choose of the hyperparameters that'll be used as inputs to the model. This next edit is just to use Streamlit to give the user those options for SVM, Logistic Regression, or Random Forest classifier, depending on what they choose.
import streamlit as st
import pandas as pd
from sklearn.svm import SVC
from sklearn.linear_model import LogisticRegression
from sklearn.ensemble import RandomForestClassifier
from sklearn.preprocessing import LabelEncoder
from sklearn.model_selection import train_test_split
from sklearn.metrics import ConfusionMatrixDisplay , RocCurveDisplay, PrecisionRecallDisplay
from sklearn.metrics import precision_score, recall_score
@st.cache_data(persist=True)
def load_data() -> pd.DataFrame:
"""
load data from a CSV and label encode it
"""
data = pd.read_csv('data.CSV')
for col in data.columns:
label = LabelEncoder()
data[col] = label.fit_transform(data[col])
return data
@st.cache_data(persist=True)
def split_train_test(df: pd.DataFrame, test_size:float=0.3) -> tuple[pd.DataFrame, pd.DataFrame, pd.DataFrame, pd.DataFrame]:
"""
split dataframe into training and test sets
"""
# y value will be the output while all the features are in the input (x)
y = df.type
x = df.drop(columns=['type'])
# use sklearn helper to split data, set random as 0 for reproducability
return train_test_split(x,y,test_size=test_size, random_state=0)
def main():
st.title("Mushroom Binary Classification")
df = load_data()
classifier_labels = ['Edible', 'Poisonous']
# create splits
x_train, x_test, y_train, y_test = split_train_test(df=df)
# allow user to choose model/classifier and hyperparams
classifier = st.selectbox("Choose Classifier Model", options=("Support Vector Machine (SVM)", "Logistic Regression", "Random Forest"))
metrics = st.multiselect("Metrics", options=('Confusion Matrix', 'ROC Curve', 'Precision Recall Curve'))
if classifier == "Support Vector Machine (SVM)":
st.subheader("Model Hyperparameters")
# number input with up and down arrows to increase/decrease by step
regularization_param = st.number_input("C (Regularization Param)", min_value=0.01, max_value=10.00, step=0.01)
# radio buttons so that we select exactly one option (rbf =Radial Basis Function)
kernel = st.radio("Kernel", options=("rbf", "linear"))
gamma = st.radio("Gamma (Kernel Coefficient)", options=("scale", "auto"))
if st.button("Classify"):
pass
elif classifier == 'Logistic Regression':
st.subheader("Model Hyperparameters")
# number input with up and down arrows to increase/decrease by step
regularization_param = st.number_input("C (Regularization Param)", min_value=0.01, max_value=10.00, step=0.01)
max_iter = st.slider('Maximum Iteration', 100, 500)
if st.button("Classify"):
pass
elif classifier == 'Random Forest':
st.subheader("Model Hyperparameters")
# number input with up and down arrows to increase/decrease by step
n_estimators = st.number_input("Trees", min_value=100, max_value=5000, step=10)
max_depth = st.number_input("Max Depth of tree", min_value=1, max_value=20, step=1)
bootstrap = st.radio("Bootstrap samples when Building trees", options=('Yes', "No"))
# convert bootstrap to bool
is_bootstrap = True if bootstrap == "Yes" else False
if st.button("Classify"):
pass
# Create checkbox to show df if clicked
is_raw_checked = st.checkbox("Show Raw Data", False)
if is_raw_checked:
st.subheader("Mushroom Dataset")
st.write(df)
# show splits dataframes
is_show_splits = st.checkbox("Show Data Splits", False)
if is_show_splits:
st.subheader("Training Set")
st.write(x_train)
st.subheader("Test Set")
st.write(x_test)
if __name__ == '__main__':
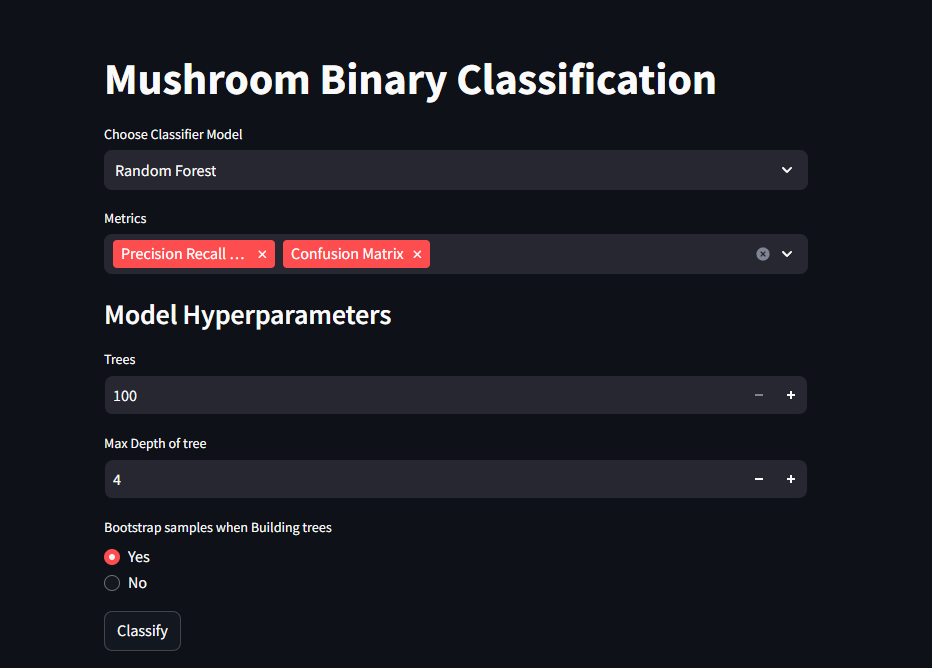
main()Different classifiers use different parameters so we want to limit the choices based on the model that we'll use. We want to use number_input for regularization and max depth params to restrict the input to numerical and only between the min and max; this will also give the user arrows next to the input that they can use to increase or decrease the value in increments of the step param. We'll use a slider to specify the number of iterations used in logistic regression so that the user can use a slider rather than having to click the arrows a bunch. We'll use st.radio for the kernel and gamma coefficient on the SVM model because there are only a handful of inputs that the user can choose. Here's what the input for random forest will look like.
Lastly notice that I've put an if statement with a st.button for each classifier. This will introduce a button that the user can click and when they click it, we'll run the model and print the results. This will be the final step!
Run and Plot
Here's the final iteration of the code!
import streamlit as st
import pandas as pd
from sklearn.svm import SVC
from sklearn.linear_model import LogisticRegression
from sklearn.ensemble import RandomForestClassifier
from sklearn.preprocessing import LabelEncoder
from sklearn.model_selection import train_test_split
from sklearn.metrics import ConfusionMatrixDisplay , RocCurveDisplay, PrecisionRecallDisplay
from sklearn.metrics import precision_score, recall_score

@st.cache_data(persist=True)
def load_data() -> pd.DataFrame:
    """
    load data from a CSV and label encode it
    """
    data = pd.read_csv('data.CSV')
    for col in data.columns:
        label = LabelEncoder()
        data[col] = label.fit_transform(data[col])
    return data

@st.cache_data(persist=True)
def split_train_test(df: pd.DataFrame, test_size:float=0.3) -> tuple[pd.DataFrame, pd.DataFrame, pd.DataFrame, pd.DataFrame]:
    """
    split dataframe into training and test sets
    """
    # y value will be the output while all the features are in the input (x)
    y = df.type
    x = df.drop(columns=['type'])
    # use sklearn helper to split data, set random as 0 for reproducability
    return train_test_split(x,y,test_size=test_size, random_state=0)

def run_plot(metrics_list: list, model, x_train: pd.DataFrame, y_train: pd.DataFrame, x_test: pd.DataFrame, y_test: pd.DataFrame, display_labels: list):
    """
    Plot metrics chosen by the user

    Args:
        metrics_list: List of metrics to plot
        model: Fitted classifier
        x_train: Train features
        y_train: True train labels
        x_test: Test features
        y_test: True test labels
        display_labels: List of class labels for display
    """
    model.fit(x_train, y_train)
    y_pred = model.predict(x_test)
    # get the metrics (precision and recall score are from scikit learn)
    st.write(f'Accuracy: {round(model.score(x_test, y_test)*100, 2)}%')
    st.write(f'Precision: {round(precision_score(y_test, y_pred)*100, 2)}%')
    st.write(f'Recall: {round(recall_score(y_test, y_pred)*100, 2)}%')

    if 'Confusion Matrix' in metrics_list:
        st.subheader('Confusion Matrix')
        cm_display = ConfusionMatrixDisplay.from_estimator(
            estimator=model,
            X=x_test,
            y=y_test,
            display_labels=display_labels
        )
        st.pyplot(cm_display.figure_)

    if 'ROC Curve' in metrics_list:
        st.subheader('ROC Curve')
        roc_curve = RocCurveDisplay.from_estimator(
            estimator=model,
            X=x_test,
            y=y_test
        )
        st.pyplot(roc_curve.figure_)

    if 'Precision Recall Curve' in metrics_list:
        st.subheader('Precision Recall Curve')
        precision_recall_curve = PrecisionRecallDisplay.from_estimator(
            estimator=model,
            X=x_test,
            y=y_test
        )
        st.pyplot(precision_recall_curve.figure_)

def main():
    st.title("Mushroom Binary Classification")
    df = load_data()
    classifier_labels = ['Edible', 'Poisonous']

    # create splits
    x_train, x_test, y_train, y_test =  split_train_test(df=df)

    # allow user to choose model/classifier and hyperparams
    classifier = st.selectbox("Choose Classifier Model", options=("Support Vector Machine (SVM)", "Logistic Regression", "Random Forest"))
    metrics = st.multiselect("Metrics", options=('Confusion Matrix', 'ROC Curve', 'Precision Recall Curve'))
    if classifier == "Support Vector Machine (SVM)":
        st.subheader("Model Hyperparameters")
        # number input with up and down arrows to increase/decrease by step
        regularization_param = st.number_input("C (Regularization Param)", min_value=0.01, max_value=10.00, step=0.01)
        # radio buttons so that we select exactly one option (rbf =Radial Basis Function)
        kernel = st.radio("Kernel", options=("rbf", "linear"))
        gamma = st.radio("Gamma (Kernel Coefficient)", options=("scale", "auto"))
        if st.button("Classify"):
            st.subheader(f'{classifier} Results')
            # run the model
            model = SVC(C=regularization_param, kernel=kernel, gamma=gamma)
            # plot metrics
            run_plot(metrics_list=metrics, model=model,x_train=x_train,y_train=y_train,x_test=x_test,y_test=y_test,display_labels=classifier_labels)

    elif classifier == 'Logistic Regression':
        st.subheader("Model Hyperparameters")
         # number input with up and down arrows to increase/decrease by step
        regularization_param = st.number_input("C (Regularization Param)", min_value=0.01, max_value=10.00, step=0.01)
        max_iter = st.slider('Maximum Iteration', 100, 500)

        if st.button("Classify"):
            st.subheader(f'{classifier} Results')
            # init model
            model = LogisticRegression(C=regularization_param, max_iter=max_iter)
            # plot metrics
            run_plot(metrics_list=metrics, model=model,x_train=x_train,y_train=y_train,x_test=x_test,y_test=y_test,display_labels=classifier_labels)

    elif classifier == 'Random Forest':
        st.subheader("Model Hyperparameters")
         # number input with up and down arrows to increase/decrease by step
        n_estimators = st.number_input("Trees", min_value=100, max_value=5000, step=10)
        max_depth = st.number_input("Max Depth of tree", min_value=1, max_value=20, step=1)
        bootstrap = st.radio("Bootstrap samples when Building trees", options=('Yes', "No"))

        # convert bootstrap to bool
        is_bootstrap = True if bootstrap == "Yes" else False

        if st.button("Classify"):
            st.subheader(f'{classifier} Results')
            # n_jobs=-1 means that we use all cores
            model = RandomForestClassifier(n_estimators=n_estimators, max_depth=max_depth, bootstrap=is_bootstrap, n_jobs=-1)
            # plot metrics
            run_plot(metrics_list=metrics, model=model,x_train=x_train,y_train=y_train,x_test=x_test,y_test=y_test,display_labels=classifier_labels)

    # Create checkbox to show df if clicked
    is_raw_checked = st.checkbox("Show Raw Data", False)
    if is_raw_checked:
        st.subheader("Mushroom Dataset")
        st.write(df)

    # show splits dataframes
    is_show_splits = st.checkbox("Show Data Splits", False)
    if is_show_splits:
        st.subheader("Training Set")
        st.write(x_train)
        st.subheader("Test Set")
        st.write(x_test)


if __name__ == '__main__':
    main()
Under each of the if statements that we introduced to begin classifying, I've added the model instantiation for the classifier as well as a call to a function run_plot. The model instantiation just takes the model selected as well as the hyperparameters.
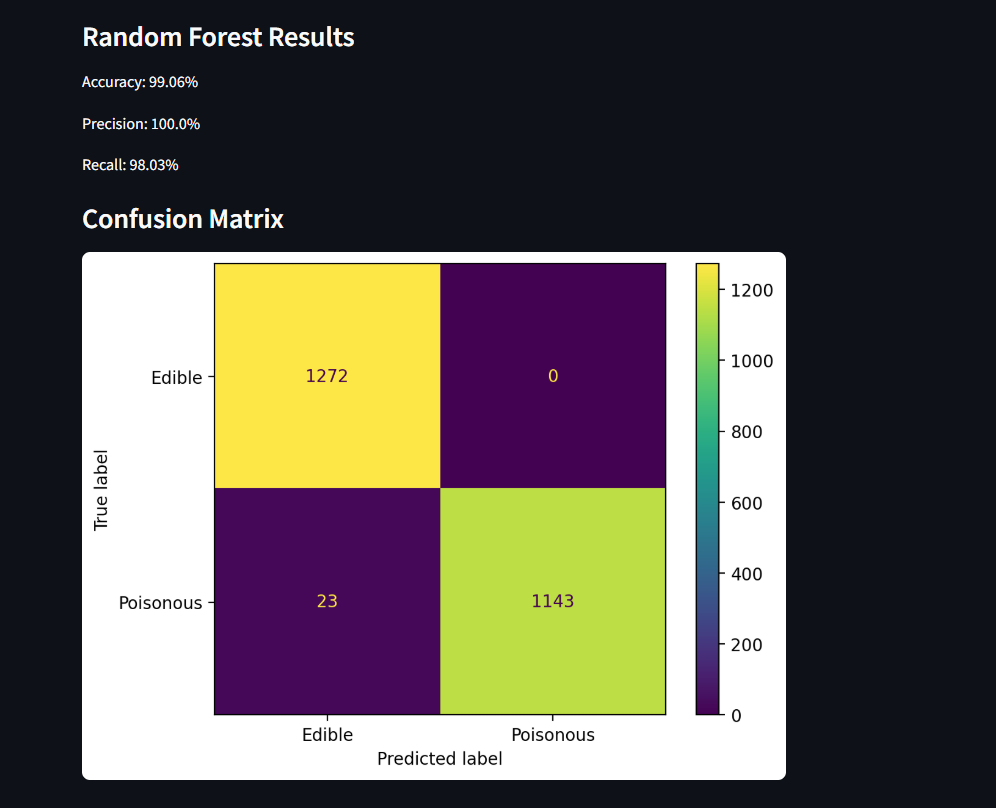
The run_plot() function will take that model that we've instantiated and then run and score the results. The following lines will use functions from sklearn to print the scores.
st.write(f'Accuracy: {round(model.score(x_test, y_test)*100, 2)}%')
st.write(f'Precision: {round(precision_score(y_test, y_pred)*100, 2)}%')
st.write(f'Recall: {round(recall_score(y_test, y_pred)*100, 2)}%')
Now, based on the metrics chosen in our multiselect list we'll use the from_estimator method on the classes to create a plot. For example, the following code will use the ConfusionMatrixDisplay class from sklearn to form a confusion matrix from the test data that we're feeding to the model. Notice we did not specify a return value in run_plot(), this is because the user has the ability to select multiple metrics and we'll just plot the value with st.pyplot(cm_display.figure_)
cm_display = ConfusionMatrixDisplay.from_estimator(
    estimator=model,
    X=x_test,
    y=y_test,
    display_labels=display_labels
)
st.pyplot(cm_display.figure_)