Using React in streamlit
by Bill Jellesma2025-03-28 00:00:00

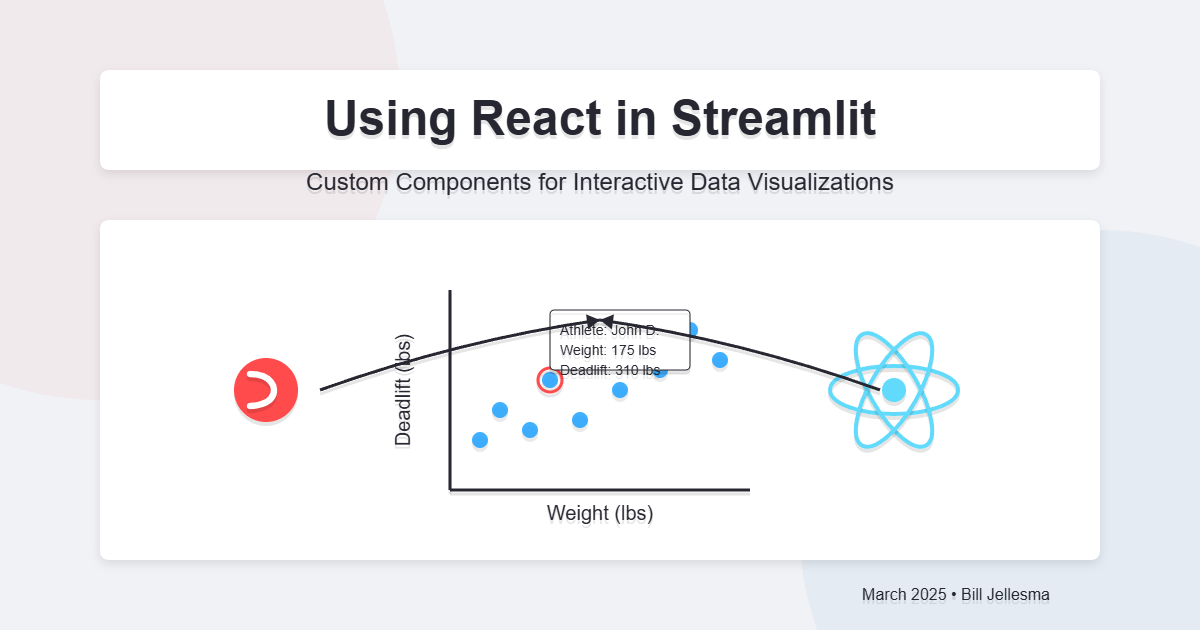
Do you want to bring your front end skills over to streamlit? Well now you can with streamlit custom components library.
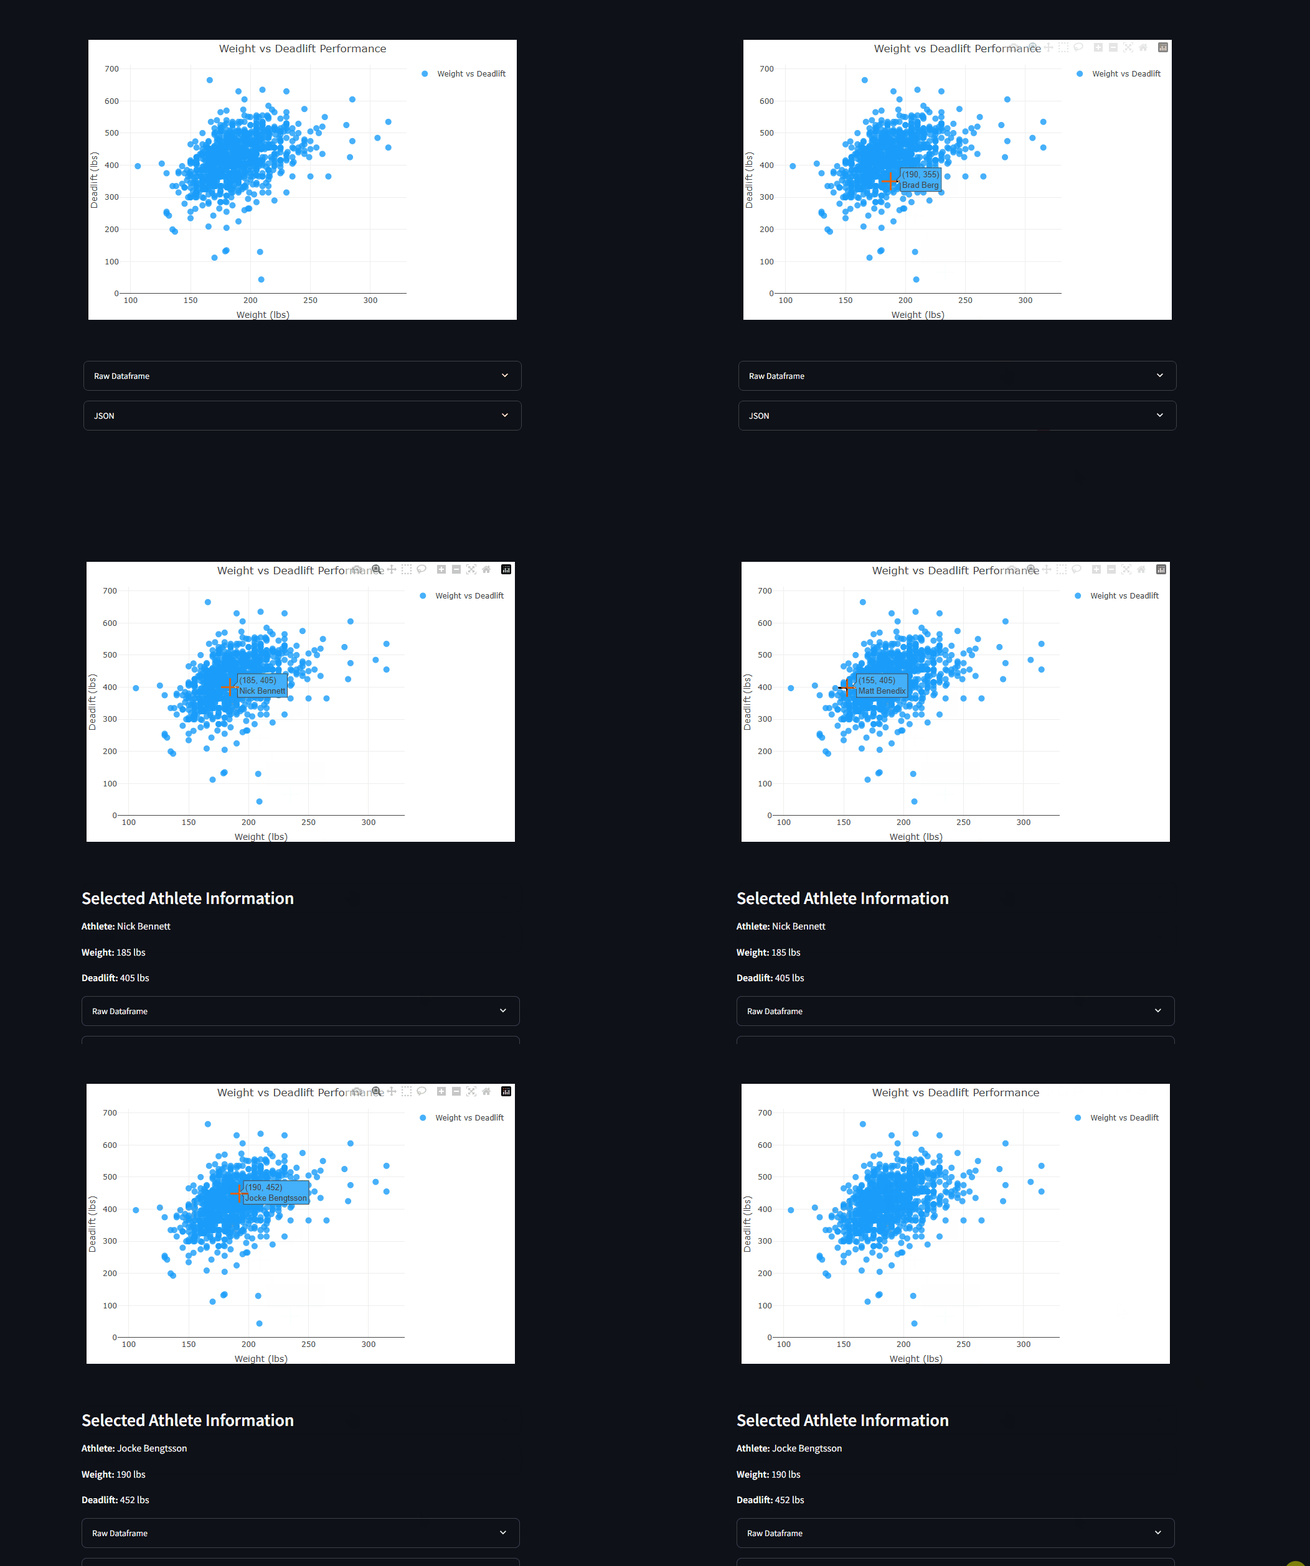
Let's create a streamlit that will display the weight vs deadlift of a sample of 1000 athletes. Let's also add some interaction to the app so that the user can click a point on the crossfit scatter plot to see more information about the athlete.

The GitHub repo is located here if you want to look at the actual code.
I've also pushed this app to Streamlit Community Cloud
TL;DR
- Start with a basic streamlit app to read a large dataset from Kaggle
- Use
Streamlit Component Libto build a component using React and Typescript - Invoke Bidirectional communication so that our React app can send data back to our streamlit app
The Deep Dive
The first thing that you'll need to do is to install a few packages that we'll need: node.js and npm (Often the two go hand in hand). I'm using WSL, so the below is the Linux command but Windows users can also download NodeJS from here
Once we create a new directory to store our streamlit code, we'll get this code under version control.
Let's first start with a simple Streamlit app. I'm using a CSV that I found on Kaggle for crossfit athletes and how they've performed on various benchmark workouts.
We'll start with a simple folder structure.
Where data.csv is the file that we've downloaded from Kaggle.
Sidenote
Before proceeding, notice that I have a Pipfile because I like to use pipenv as my virtual environment. I've posted about pipenv before here, so I'll just show you the code so that you can see the dependencies and the scripts that I'm using. The Pipfile.lock file is also generated automatically when installing these dependencies/
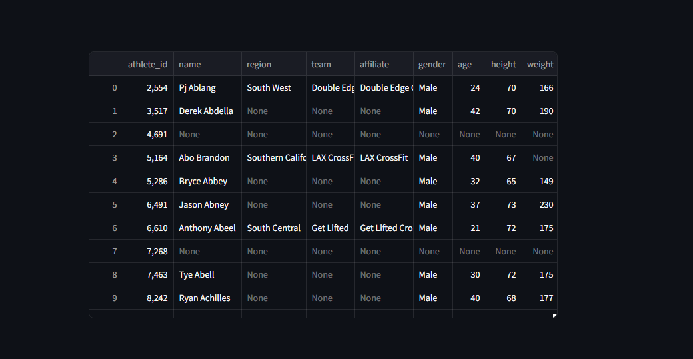
Now let's make main.py. For now, we'll just use st.dataframe to show the data from that CSV.
As you can see, the app isn't incredibly interesting yet as we're just displaying the data.

Now let's add in some frontend engineering to spice things up a little.
Add a pinch of React
Now what we want to do is to add React code to show a scatter plot.
First thing that we'll do is to improve upon the folder structure of our app in order to make room for our component.
You'll notice that we've added a .gitignore file in here as well so let's go ahead and add to that file. We'll just add one line in there for now.
This is because we plan to add a node_modules folder.
node package manager (npm)
npm may be a new concept for those coming from the streamlit and data science world. All that npm is is just a package manager that you can use to manage your JavaScript dependencies. It does this through a special file you create called package.json. npm even has a command that will help you to create this file so let's do that.
npm init is just an easy way to create the needed package.json. You'll be presented with a series of questions to get started with the file.
Notice that a package.json will be created in your frontend directory. Hold tight! There are a couple of things to update this file with.
Notice how streamlit_component_lib is one of the dependencies. This is at the heart of our application component that will help serve the frontend react app that we're creating and even connect it back to our streamlit app.
You'll also want to update the scripts section. These scripts will provide the npm commands that we'll use to develop the component
Your package.json should now look like this
You can now use the following command to install all of our frontend dependencies.
This installation may take a couple of minutes but notice that this will create a node_modules folder which is quite large. This is why we added this to the .gitignore.
Files
Now we'll start adding files to fill in the folder structure that we provided earlier.
crossfit_scatter_plot/frontend/public/index.html
For those familiar with frontend frameworks (React, Vue, Angular), this is the base file that you'll need. It simply provides a root id which we'll connect to with our typescript.
crossfit_scatter_plot/frontend/.env
This is an extremely short file. What it'll be used for is that, when we run the dev server for our component, it'll instruct it to run on port 3001. The port number can be whatever but oftentimes streamlit is running on 3000 and when this file isn't specified, the component will try to run on 3000. The browser command is useful just because there's no point in opening the browser for the component dev server, you won't see anything.
crossfit_scatter_plot/frontend/.prettierrc
While not strictly necessary, this file is nice to have for developers working in vscode. VS Code automatically uses prettier to format files on save. This just adds a couple of additional commands.
crossfit_scatter_plot/frontend/tsconfig.json
Unlike other files, the tsconfig is very important to have. The most important setting in here is the include command. This command will process any files in our src/ directory ensuring that typescript is enforced whenever saving files.
crossfit_scatter_plot/frontend/src/index.tsx
This file is the entry point for our React application. Notice that we're referencing the root ID. ReactDOM is instructed to bind its React tag to bind to an ID of root.
Now, we'll create the custom component
crossfit_scatter_plot/frontend/CrossfitScatterPlot.tsx
For users coming from the python world, this React code may seem a little confusing but let's break it down.
Before we break it down, I do just want to point out that this is technically typescript code and not pure JavaScript. Think of typescript as just a layer of top of JavaScript; it's often referred to as a superset as it uses a lightweight compiler to compile down to pure JavaScript. The advantage of using typescript is that it adds type safety that JavaScript alone doesn't support. This means that if you specify a function as taking in a number, but you have another function that passes a string, the compiler will yell at you and not allow you to compile the JavaScript and therefore not allow you to ship your code to production without fixing this inconsistency.
First we'll import the libraries. We'll import the streamlit custom lib code. We also want useEffect from React. This is used here so that we can immediately run code when the component mounts.
Plotly maintains a custom <Plot> element that we can use. The reason that we're adding the import for Data and Layout from plotly.js is because we'll use these types in a typescript interface to enforce that we get the proper types from python.
The next code that starts with the keyword interface is the typescript interface that we were discussing above to enforce that we get the expected data from python.
This next line is how we declare a React Component. Notice that this uses the props interface that we created. args is defined to be the object that we've passed in from python. I say object because each argument that we've passed from python will be a property on that object. So args.data will be the data dictionary that we've passed from python to our component.
Within the code block, we first find useEffect. This is a React feature that is used to detect when certain events occur such as a user performing an action so that our application can run code in response. In this case, the empty square brackets indicate that the code is to run when the component is first mounted and ready. We're using this so that we can tell streamlit to set the height of the component to 500 pixels.
We'll skip straight to the return value first and come back to our other section.
So the first thing to notice about our return value is that it follows the syntax of a shorthand if statement in JavaScript (and typescript). The code in the parentheses after the ? executes if the code before the ? is truthy meaning it's defined (not null or false). If the code is null or false, it'll execute the code after the :
So we can apply that knowledge to know that if both data and layout have been defined in the args, then we will execute the <Plot> element, otherwise we will show a div saying that we have no data. Remember earlier that we've imported <Plot> from Plotly. Like any Plotly figure, we'll need to specify a data and layout parameter. We're passing these from python. We can also specify a style attribute for an inline style with any applicable CSS. This is something that Streamlit natively does not support, so this is one nice feature of using components. There is the config attribute where we want to specify this figure as responsive to play nicely with users with different screen sizes (including on mobile). Lastly, we have an attribute call onClick. This is an extremely cool attribute! This is a JavaScript event where we can run a function whenever a user clicks on one of the markers.
Now, let's circle back to the handleClick function. This was the value of the onclick attribute from earlier. We'll use this click event to demonstrate the bidirectional flow of Streamlit by setting a component value using Streamlit.setComponentValue. Notice that we're specifying clickData as the parameter for this function. clickData will contain all the information about the user's click event. This will be an array of data in which we just want the first value to get the data that we're interested in. For example, clickData.points[0].text will be the text of the point which in this case is the athlete's name.
One final statement at the end of the file is that we need to return the component back to Streamlit.
The final file we need for the actual component is the __init__.py file which will dictate the connection that the streamlit code will have with the component.
components.declare_component() is the function that'll specify where the code for our component can be executed from. I'm using a _RELEASE variable as a boolean that I will manually set in the code to dictate whether I've built the production version of the component. If the variable is false, then we just use the port that we've specified earlier in the .env to say that our component is currently served on that port. This enables it so that when we make a change to the typescript, that change will nearly instantly be rendered in streamlit. If the variable is True, then we've built the component and all of our code will be in the frontend/build folder. The advantage is that this will be an optimized build that should be faster.
The last part to note is that we're creating the function crossfit_scatter_plot that we'll be importing in streamlit. This function will call _component_func() which is a function that is determined by the boolean _RELEASE
Phew! This concludes writing the component as well as the hook. All that's left to do now is to update our Streamlit app to use this component.
Back to Streamlit
To add this component, we'll first want to import the component.
Next, we'll also want to specify that data and layout for our scatter plot in python. This way our python is still in control and our React component will refresh with the new data whenever we change our data. Let's add two functions to help us.
Our parse_data function will serve the purpose to clean the data and get it ready to be sent to the component. We're filtering three times in this function. First we're dropping all records that are null in either of the two columns we're interested in.
Second, we have a lot of outliers and data that doesn't make sense like a negative value for a deadlift weight. We'll use the following filter to say that people must weight between 100 and 500 pounds and their deadlift weight must be between 10 and 1000 pounds.
The last filter will just limit the results of that filter to 1000 rather than use the entire CSV of data.
Now we'll just return a list of the data that our component will be looking for. We specify that x will be the weight and y will be the deadlift, and we convert the columns of that data frame to a list so that it is json serializable. The text of this data will also include the name of the athlete so that we can identify the point on the plot.
The create_layout function is a little easier to explain as all it's doing is saying what the labels of the axes are going to be.
We're also going to need code to actually call and display the component. Notice that we're also assigning the value of the component function. This is where the bidirectional communication comes in. We'll assign the variable selected_point to be the value that setComponentValue from React sends back. This will be a dictionary in python. So if we have a value for selected_point (the user has clicked a point and sent something back to Streamlit), we'll display values of that data point.
Lastly, we'll use streamlit expanders to display the dataframe and the json that we're sending to React. This may give us some debugging capability
So here is the full streamlit app code.
Now we'll see a scatter plot of a 1000 crossfit athletes with their weight vs their deadlift. Notice that we're also able to click any point on the plot and have our streamlit app render the athlete's information.

Just Build the thing
Before we wrap up, it'd be worth it to mention how to actually build the component. Up until now, we've been use npm to render the component locally on our machines. This is nice for developers because we can make changes and have them instantly reflected in our application. But this isn't going to work for a production system to rely on an open port to serve content nor is the component optimized. What we'll want to do when we're ready to deploy it with our streamlit app is to build the component.
Luckily, it's pretty easy to build the component. Just like we run npm run start to start our component in development mode, we can run npm run build to build a production version of the component.
When you run npm run build, the component will begin building to the previously uninhabited build/ folder in the same directory.
Once you build the component, there is just one thing to change so our Streamlit App knows to use this new built version. Remember we created a variable in __init__.py called _RELEASE? Well now, all we need to do is to set that variable to True. By doing that, Streamlit will use the conditional statement to use the build/ folder instead of looking for the component on localhost.
Concluding
So, what have we learned? Well we learned how to take our frontend skills with React and apply them to create a component in Streamlit. This component will help to enhance our Streamlit App by letting us take advantage of things like state and click handler events.